ML status
Machine learning (ML) status shows the stages of machine learning implemented in a policy used with analyzing a sequence to suppressing alerts:
| ML Status | Description |
|---|---|
 | Insufficient data. The policy is temporarily disabled. Due to insufficient data, the machine learning model cannot detect any alert sequences and the policy is temporarily disabled. The policy becomes active when the machine learning model has sufficient data. |
 | Training ML model is queued. When a policy is created or a CSV file is uploaded to a policy, the training can be queued. If a policy is in training, the new policy is queued. Once the training on the existing policy is completed, the status of the new policy moves to training initiated. |
 | Training ML model is initiated. After completion, training on the machine learning model is initiated. The status then moves to training started. |
 | Training ML model is started. After completion, training on the machine learning model is started. Training progress is shown on the progress bar. |
 | Training ML model is in progress. After completion, training on the ML model continues with the percentage of progress shown in the progress bar. |
 | ML model training is complete. Predictions will commence and the ML model detects alert sequences and suppression. |
 | ML training encountered an error. Contact support for assistance. |
ML seasonality patterns
Alert seasonality patterns helps detect seasonal patterns of alerts. These patterns are based upon unmodified alert information retrieved from existing data. OpsQ suppresses an alert that matches with the seasonality pattern detected by ML. For example, if an alert appears at 10 PM on Mondays, OpsQ suppresses the alert triggered at 10 PM on Mondays.
ML retrieves three months of alerts and groups alerts based on three attributes (resource, metric, and component). Seasonal patterns of alerts are studied for each group. Alert groups that have seasonal patterns are listed and displayed when a group is selected.
Note
- 90% of the alerts must be seasonal to qualify as seasonal alerts.
Seasonality pattern graphs
Seasonality pattern graphs have the following attributes:
- Resource, metric, and component: Attributes of alerts and the seasonality group that is selected.
- Numbers (displayed horizontally): The timeline with dates within a month. Hover over the dates to view the date and time for each generated alert.
- Grey lines: The past alerting time for a specific group (resource, metric and component).
- Orange lines: The predicted alerting time based on the learned alert seasonality.
- Blue shaded area: Zoom in (or zoom out) on the blue line to examine time duration.
Note
Seasonality groups in the graph refers to alert groups that have seasonal patterns.The following graph provides the details of the seasonal patterns for alert data and describes when OpsQ suppresses
alerts due to matching seasonal patterns: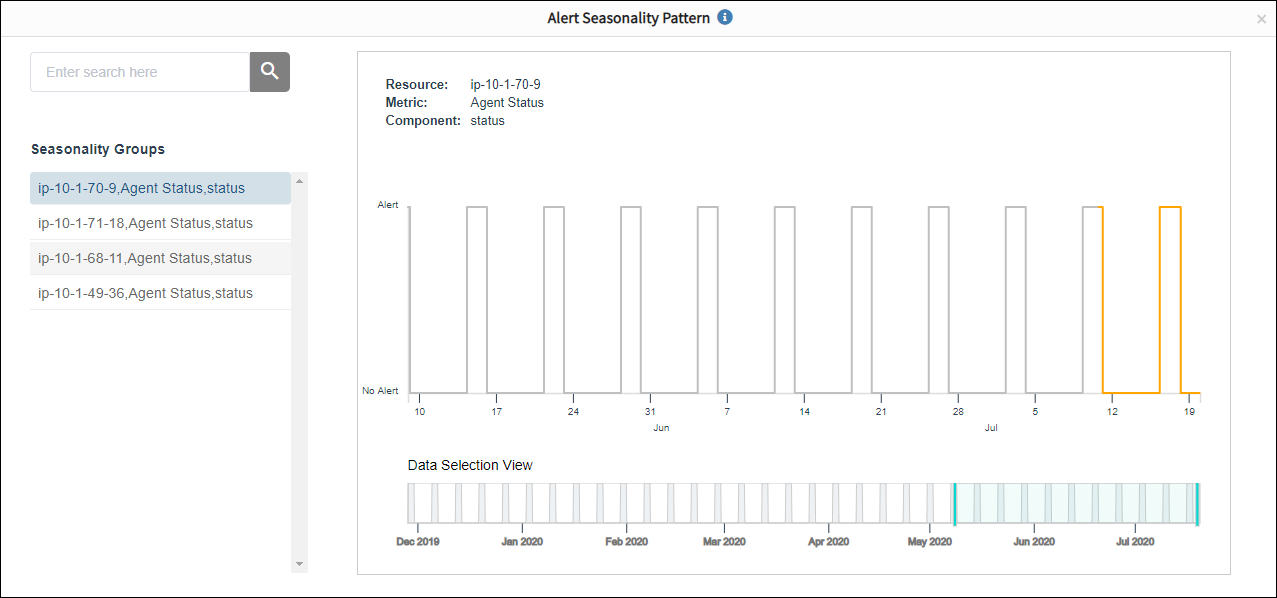
Alert Seasonality Pattern
This is a sample recommendation by the OpsQ bot for a suppressed seasonal alert:
OpsQBot Recommendation for Seasonal Alert
The following graph shows the seasonal pattern of a suppressed alert: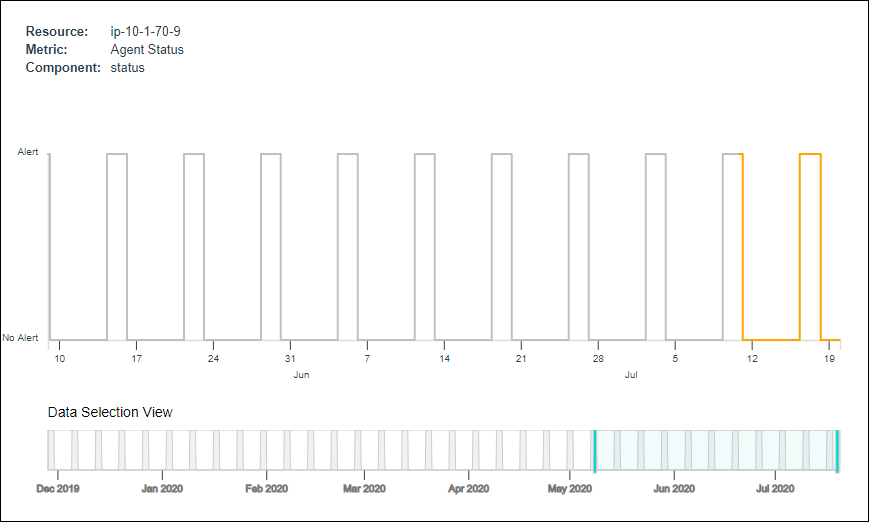
Seasonal Alert Graph